Welcome to the world of crypto trading! If you’ve ever looked at a price chart and seen a confusing jumble of lines and bars, you’re in the right place. This guide is designed to simplify BitUnix technical analysis for absolute beginners. We’ll break down how to read charts, spot trends, and use simple tools like BitUnix trading indicators to make more informed trading decisions. Forget the complex jargon; our goal is to give you the foundational skills to understand market movements and start your trading journey with confidence on the BitUnix platform. By the end of this article, you’ll have a clear roadmap to analyzing cryptocurrency prices and making your first predictions.
What is Technical Analysis? (The Basics for Crypto Newbies)
In simple terms, technical analysis is like being a market detective. Instead of digging into a company’s finances (which is called fundamental analysis), you study past market data, primarily price and volume, to predict future price movements. The core belief is that all known information is already reflected in the price, and that prices tend to move in recognizable patterns.
Understanding the Core Principle
Key Idea: Price Tells a Story
For a crypto newbie, this is fantastic news. Why? Because you don’t need a degree in finance to start. By learning to read the story a chart tells, you can identify potential opportunities to buy or sell.
- Focuses on “What”: What is the price doing?
- Not “Why”: Why is the price doing it?
- Uses Charts: Price charts are your primary tool.
- Identifies Patterns: History often repeats itself, and these repetitions form patterns.
This approach is particularly popular in the fast-paced crypto market, where sentiment and momentum can cause rapid price swings.
Why BitUnix is Your Ideal Platform for Technical Analysis
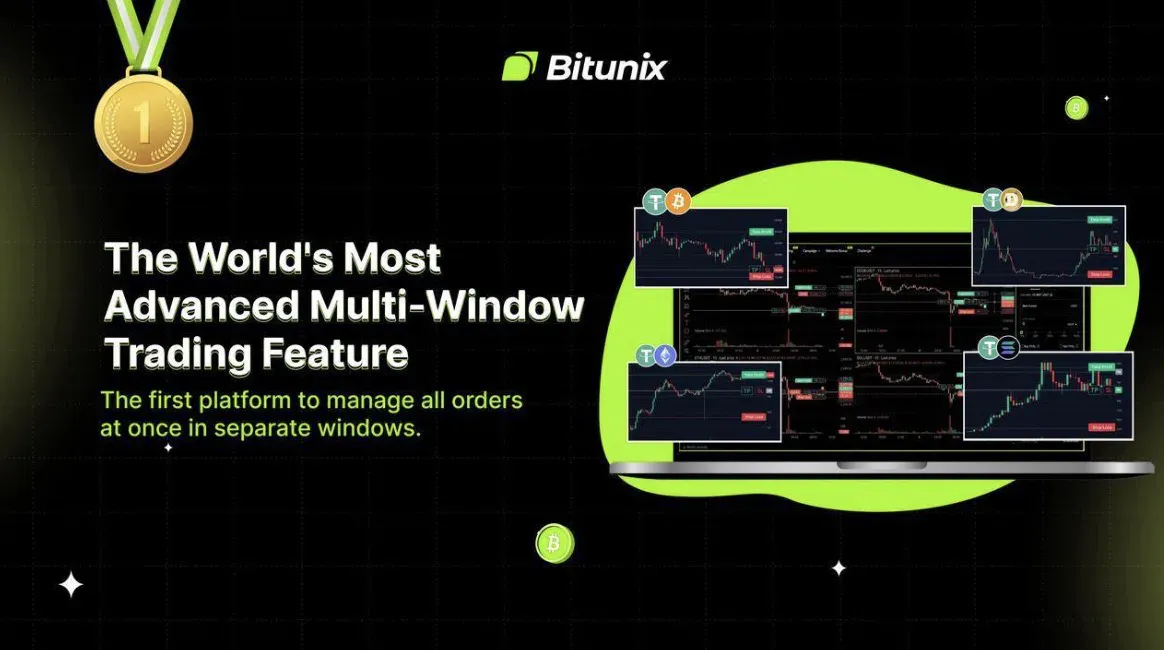
Choosing the right platform is just as important as learning the right skills. For beginners, the powerful technical analysis tools on BitUnix are presented in a user-friendly interface. You get access to advanced charting features without the overwhelming complexity found on other exchanges.
Here’s why BitUnix stands out:
- Intuitive Charts: Clean, responsive, and easy-to-read charts that you can customize.
- Wide Range of Tools: Access dozens of indicators and drawing tools, including all essential BitUnix trading indicators.
- Real-Time Data: Make decisions based on the most up-to-date price information.
- Seamless Trading: Instantly act on your analysis by placing trades directly from the chart interface.

Core Concepts of BitUnix Technical Analysis
Now, let’s get to the fun part. Understanding the following concepts is the key to unlocking the power of technical analysis. Think of them as your starter toolkit.
Reading the Charts: Candlesticks Explained
The most common type of chart you’ll see is a candlestick chart. Each “candle” tells you a story about the price over a specific period (e.g., one hour, one day).
- The Body: Shows the price range between the open and close. A green (or white) body means the price closed higher than it opened. A red (or black) body means the price closed lower than it opened.
- The Wicks (or Shadows): The thin lines above and below the body. They show the highest and lowest prices reached during that period.
By looking at a series of candles, you can quickly gauge the market’s mood—is it bullish (buyers are in control) or bearish (sellers are in control)?
Identifying Trends: The Foundation of Price Prediction
The goal of technical analysis is to trade with the trend. A trend is simply the general direction the market is heading.
- Uptrend (Bullish): A series of “higher highs” and “higher lows.” It looks like a staircase going up. You can draw a “trend line” connecting the lows.
- Downtrend (Bearish): A series of “lower highs” and “lower lows.” It looks like a staircase going down. You can draw a “trend line” connecting the highs.
- Sideways Market (Consolidation): The price trades within a relatively stable range, without a clear upward or downward direction.
The trend is your friend.
Key BitUnix Chart Patterns for Beginners
As prices move, they often form shapes or patterns that can signal where the price might go next. Learning to spot these BitUnix chart patterns can give you a significant edge. Here are a few basic ones:
- Head and Shoulders: A bearish pattern that often signals the end of an uptrend. It looks like a peak (left shoulder), followed by a higher peak (head), and a final lower peak (right shoulder).
- Double Top / Double Bottom: A “Double Top” is a bearish pattern where the price hits a high point twice but fails to break through. A “Double Bottom” is the opposite—a bullish pattern where the price hits a low point twice and then begins to rally.
- Triangles (Ascending, Descending, Symmetrical): These are continuation patterns. An ascending triangle (flat top, rising bottom) is typically bullish. A descending triangle (falling top, flat bottom) is typically bearish.

Essential BitUnix Trading Indicators for Your First Trade
Indicators are mathematical calculations based on price and/or volume, displayed as lines or graphs on your chart. They help confirm trends and identify potential buy or sell signals. Don’t be intimidated; start with these three popular BitUnix trading indicators.
- Moving Averages (MA): A moving average smooths out price data to create a single flowing line, making it easier to see the trend direction. A common strategy is to watch for when the price crosses above the MA (a potential buy signal) or below it (a potential sell signal).
- Relative Strength Index (RSI): This indicator measures the speed and change of price movements. It moves between 0 and 100. A reading above 70 suggests an asset is “overbought” and could be due for a price correction down. A reading below 30 suggests it’s “oversold” and could be due for a bounce up. You can read more in Investopedia’s guide on RSI.
- Moving Average Convergence Divergence (MACD): This indicator shows the relationship between two different moving averages. It consists of two lines (the MACD line and the signal line) and a histogram. When the MACD line crosses above the signal line, it’s a bullish signal. When it crosses below, it’s a bearish signal.
Generating BitUnix Trading Signals From Your Analysis
So, how do you combine all this into actionable BitUnix trading signals? The key is confluence.
Pro Tip: Look for Confluence
Confluence is when multiple different indicators or patterns all point to the same conclusion. You don’t want to trade based on just one signal. A strong trading signal might look like this:
- Observation 1: The price is in a clear uptrend.
- Observation 2: The price has just bounced off the lower trend line.
- Observation 3: A bullish “Double Bottom” pattern, a classic BitUnix chart pattern, has formed.
- Observation 4: The RSI, a key BitUnix trading indicator, is moving up from oversold territory (e.g., from 28 to 35).
When you see multiple signs aligning, your confidence in a potential trade increases dramatically.
A Step-by-Step Guide to Performing Your First BitUnix Technical Analysis
Let’s walk through a hypothetical example using the BitUnix platform.
Your First Analysis on BitUnix
-
Choose Your Asset
Log in to BitUnix and pick a crypto you want to analyze, like BTC/USDT.
-
Set Your Timeframe
Start with a daily chart (where each candle is one day) to identify the main trend.
-
Draw Your Trend Lines
Is the price making higher highs and higher lows (uptrend) or the opposite? Connect the peaks and troughs to visualize the trend.
-
Add Your Indicators
Add a simple Moving Average (e.g., 50-day) and the RSI indicator to your chart. Explore the available BitUnix trading indicators.
-
Look for Patterns
Scan the chart for any of the BitUnix chart patterns we discussed. Is there a triangle forming? Did the price just break out of a consolidation range?
-
Find Confluence
Does the RSI support what the price action is telling you? Is the price above its 50-day moving average, confirming the uptrend?
-
Form a Hypothesis
Based on your analysis, make a prediction. “Because the price is in an uptrend, has bounced off the trend line, and the RSI is not overbought, I predict the price is likely to continue rising in the short term.”
This entire process, as outlined in this guide to BitUnix technical analysis for beginners, is your framework for making data-driven decisions.
Common Mistakes to Avoid in Crypto Technical Analysis
As a newbie, it’s easy to fall into a few common traps. Being aware of them can save you a lot of money and frustration.
Common Pitfalls for New Traders
- Analysis Paralysis: Using too many indicators at once, leading to conflicting signals and confusion. Stick to 2-3 at first.
- Ignoring the Main Trend: Trying to “catch a falling knife” by buying in a strong downtrend. It’s usually better to trade with the trend.
- Emotional Trading: Letting fear or greed dictate your decisions after a small loss or a big win. Stick to your analysis.
- Risking Too Much: Always use proper risk management. Never invest more than you are willing to lose on a single trade. As noted in reports by financial regulators like the FCA, this is crucial.

BitUnix Price Prediction: Using Analysis to Look Ahead
Ultimately, the goal of this analysis is to make a reasonable BitUnix price prediction. It’s important to understand that technical analysis is not a crystal ball—it’s a game of probabilities. It won’t be right 100% of the time.
However, by consistently applying the principles of trend analysis, chart patterns, and indicators, you are stacking the odds in your favor. You are moving from pure gambling to making educated guesses based on historical data and market psychology. Your goal isn’t to be perfect; it’s to be right more often than you’re wrong over the long term.
Ready to Put Your Knowledge Into Practice?
The best way to learn is by doing. Open an account on BitUnix to access professional-grade charting tools and start analyzing the market today.
Open Your Free BitUnix Account Now!Conclusion
Mastering BitUnix technical analysis is a journey, not a destination. Today, you’ve learned the essential building blocks: how to read candlesticks, identify trends, recognize basic BitUnix chart patterns, and use core BitUnix trading indicators. You now understand that combining these elements helps you find high-probability trading signals and move beyond guesswork for your price predictions.
Remember to start simple, manage your risk, and never stop learning. The charts have a story to tell, and you now have the tools to start listening. Take the first step on your trading journey. Open the charts on BitUnix, apply what you’ve learned, and watch the market in a whole new way.
